
Simulation on Binary Star Formation
- Zachary Sun

- Oct 16, 2018
- 3 min read
Updated: Dec 17, 2018
Detecting differences between Single star systems and Binary star systems through NH3(1,1) emission lines
How does a star form?
We know there are giant molecular clouds in the universe.
When the gravity of the clouds is large enough.
They condense and collapse into dense cores that will eventually form stars.
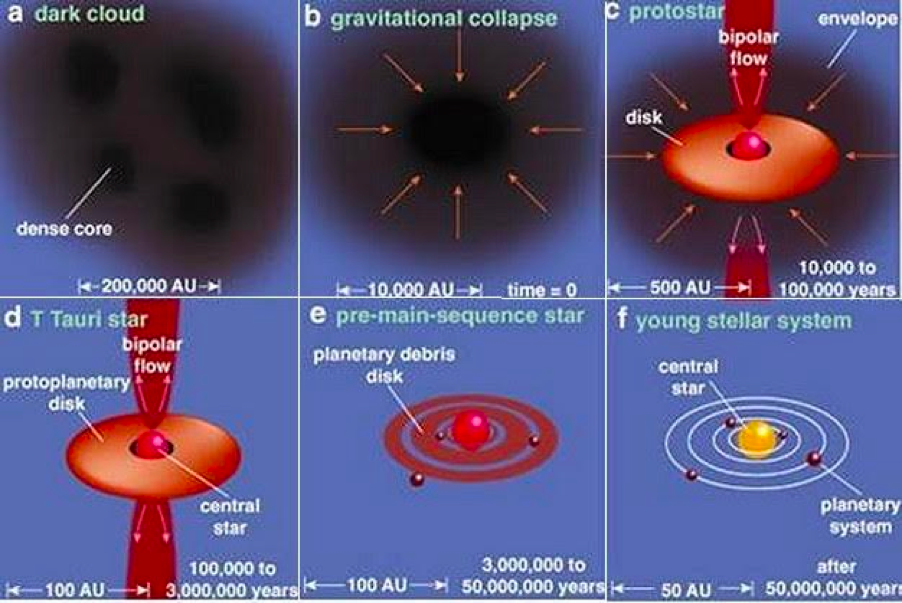
Source: Spitzer Science Center. Ref 3.
The physics of the universe, physicsoftheuniverse.com, accessed 2 July 2015.
How might a binary star system form?
Two factors that are well understood:
1 Star forming cloud splits into two (or more) parts, each forming a star.
2 A proto-star with a disk is formed, disk breaks up and forms another star.
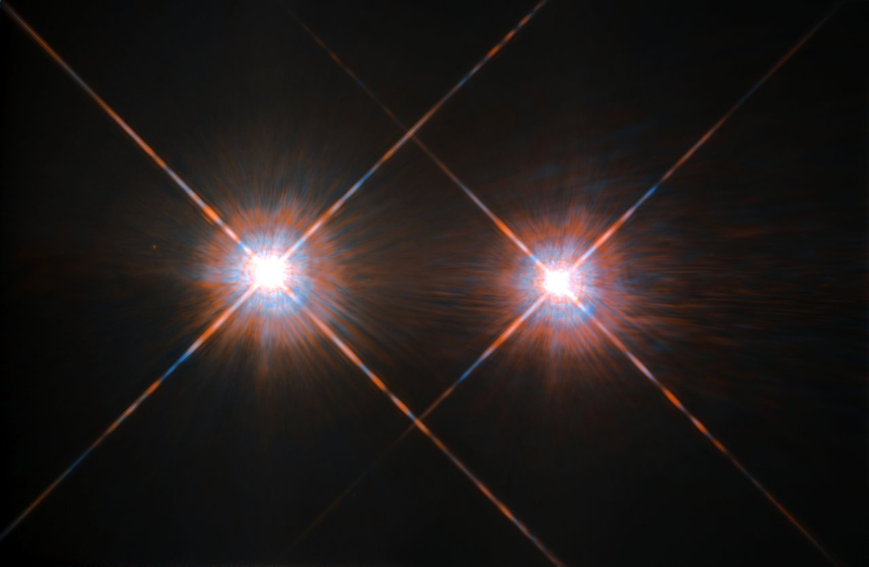
Image credit: ESA/NASA
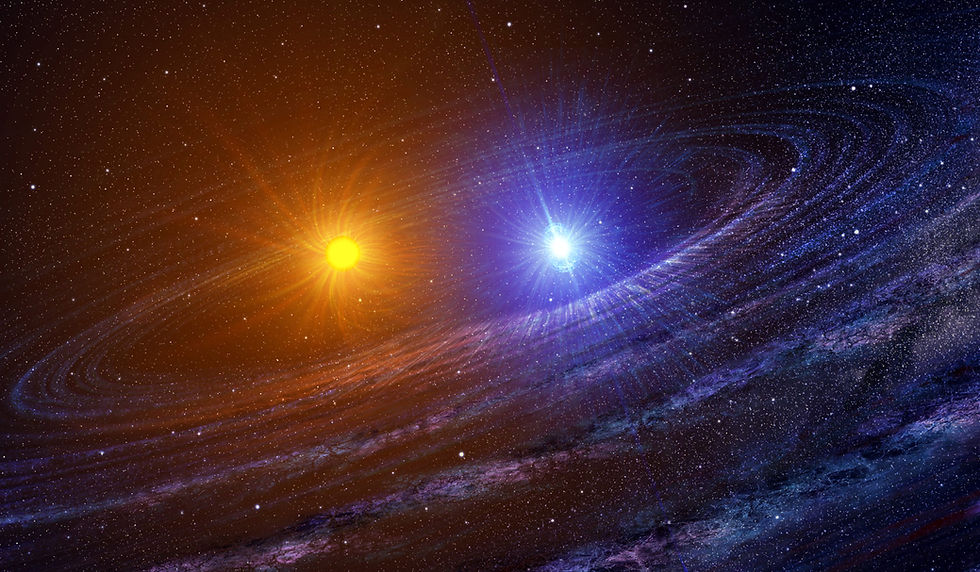
What makes binary star systems interesting?
They help us to have a better understanding about light sources, since the the same amount of luminosity might be from a single star system, or a binary star system, sometimes it’s hard to tell.
The environment around a single star sys and binary star system are different. Planets might orbit differently.
Dust Emission

Credit:Friesen & Pineda et al. 2017
It is a map of a molecular cloud in dust emission (red); the black contours show where NH3 is detected. So the column density plot in size corresponds to one of those small black contours.
We are simulating data to create synthetic observations which will allow us to detect the possible observable differences between the cores that form single star systems and the ones that form binary star systems. We will know exactly the time information of each stage of star formation, and it is useful for observers and the study of star formation.
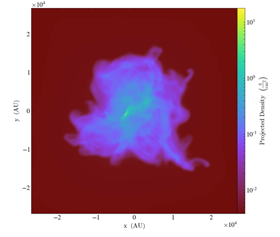
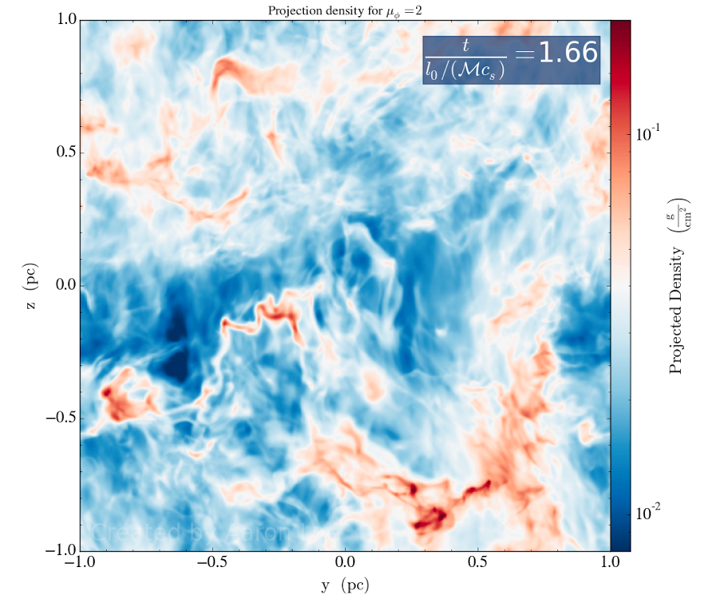
Column Density
Why do we choose NH3(1,1)(Ammonia)?
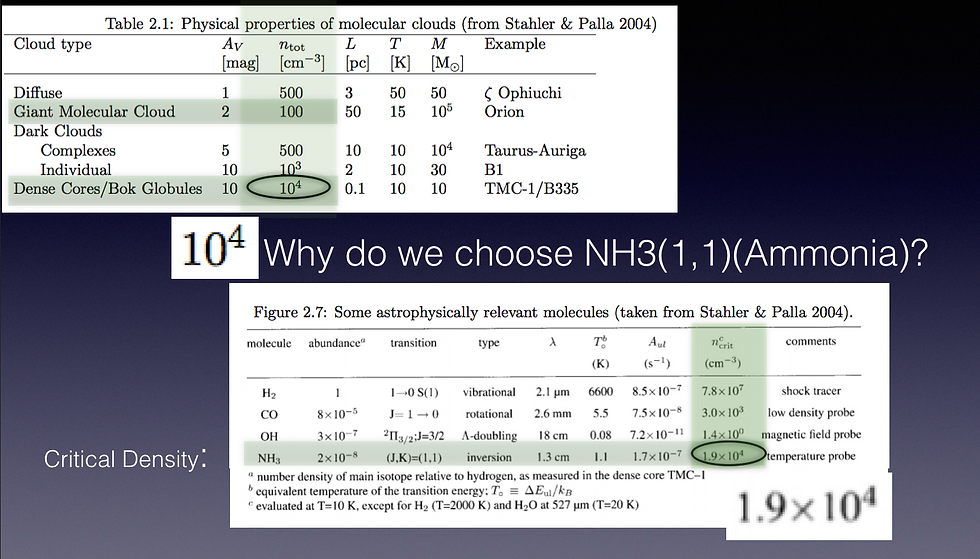
GMC nden 100, DC 10^4
Reason for nh3: CD is close to nden DC, will be able to probe deep enough and finally reach the core, for other gas, CO, nden is 3e3, it might appears to be optically thick.
Process chart

Hydrodynamic data file from O2, yt takes the file and exports all the useful information such as nh3 den, h2 nden, gas temp, etc. Output files provide Radmc with enough initial conditions to calculate radiative transfer emissions for all wavelengths centered around the emission line of nh3(1,1). Store information in a file. We then use the PR we have generated to generate different kinds of plots.
YT is a plotting and analysis package written in python, it works well with large hydrodynamic files and provides all the information RAD needs.
RAD radiative transfer code package which calculates the radiative emission for each given wavelength. Plots 256^2 arrays of pixels, with 256 wavelengths.
Spectrum plot at a given pixel(single column)

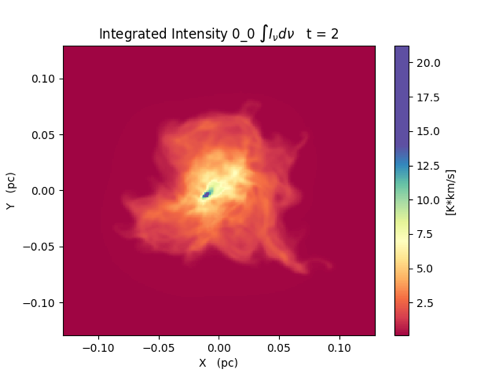
Integrated intensity plot and pick some pixels to make multiple spectrum plots. Picked 5 points that are adjacent vertically to the pixel that has the highest intensity. They are all centered around the nh3(1,1) emission line. Near the core, the gases are more acquiesce, which makes the shapes to be relatively sharp, which means the doppler effect is minimal. Converted the unit into Kelvin by using Rayleigh-Jeans law
Integrated intensity plot
Two Stars
t=0 to t=4: 23465.2 yrs

One Star
t=0 to t=3: 52321.2 yrs
Normalized integrated 1st moment plot
Two Stars

One Star
Normalized integrated 2nd moment plot
Two Stars
One Star
Nextsteps:
Try to look at the gas from two other angles so that we can have a wholesome view of the process. I will also use more real data instead of the data I have now. Because the data files I have are generated under those initial conditions and we are assuming the core is in spherical shape, while realistically it could be in any shapes, and will be much harder to run the simulation.
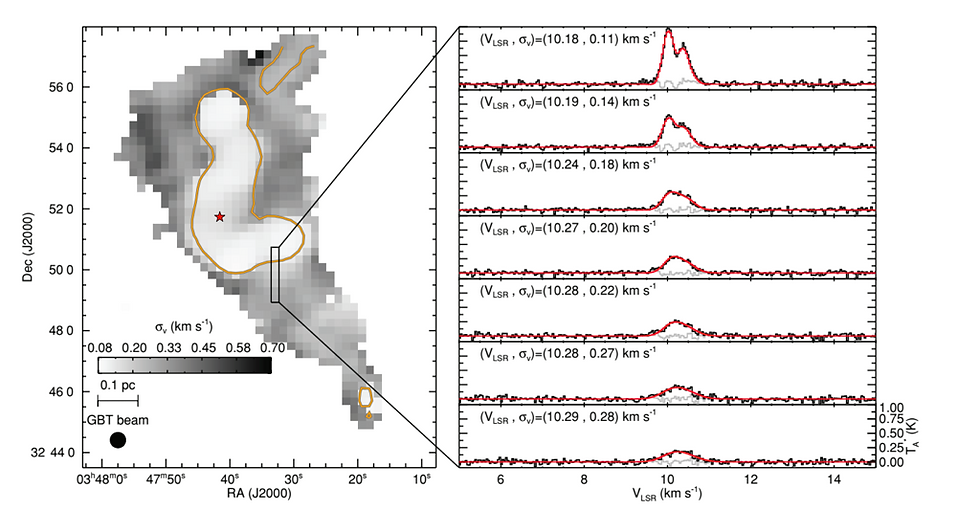
Credit:Pineta et.al,2010
By looking at this plot from the Pineda et.al paper, color bar shows the velocity dispersion. we can see star forming region has a significantly low velocity dispersion. We can tell from the spectrum fitting plots on the right that the farther away it is from the center, the more dispersed the velocity is.
Experimental progress was made until July 28th 2017.

Comments